Prometheus exporter for the Growatt ShineWifi-X data logger
We have recently installed a solar power inverter by Growatt for the solar panels on our roof. These inverters support a little USB dongle that can send metrics via Wi-Fi to some cloud-based logging server hosted by Growatt. The dongle I have is a “ShineWifi-X”. Since I’d rather log and visualize these metrics myself using Grafana and Prometheus instead of using their cloud and app, I wondered if I could just use the existing stick and redirect its traffic to a custom server. After some digging, I’ve found a couple of projects and documentation for these Growatt dongles. However, none of these existing solutions fit my use case (no Prometheus support) and the documentation seemed to be outdated (i.e. for an older product/firmware). But, since these devices speak a pretty simple TCP-based protocol and changing any of the existing projects would be more trouble than it’s worth, I created my own little daemon in Rust. It accepts (one or more) connections from the data logger(s) and understands a minimal set of commands/messages to make data collection work. As far as metrics are concerned, I tried exporting all metrics that seemed useful. It does not depend on any Growatt cloud services and the like.
To compile it, install Rust and just run cargo build or cargo build --release.
Alternatively it can be run directly using cargo run.
I tested it on Windows (amd64) and on the Raspberry Pi 4 (armv7) running Arch Linux - both work without problems.
In order for the data logger to connect to it, one has to first press the little reset button on the logger while it’s attached to the inverter.
It will reboot, a blue LED will light up and it’ll host a Wi-Fi access point.
Connect to that using a laptop or smartphone, then open a web interface on http://192.168.10.100.
The default password should be 12345678.
There should be an option for “Server IP” and “Server Port” somewhere in the settings.
Set these to the IP/Port of the Growatt exporter tool.
You’ll probably also have to disable the “Default Domain” option, not sure what that does.
Afterwards, hit apply and then reboot the thing once more.
It should now try to connect to the exporter daemon.
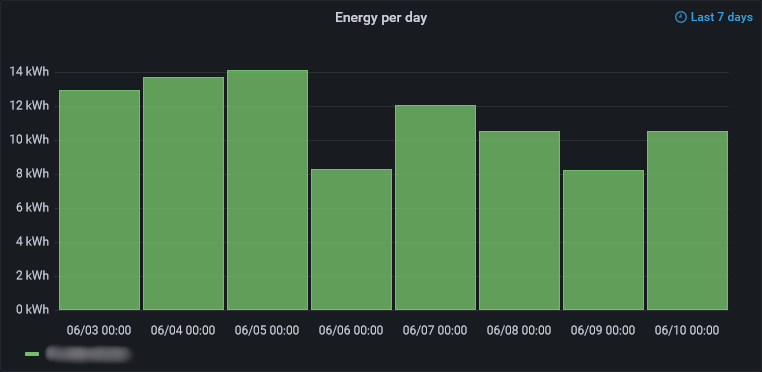
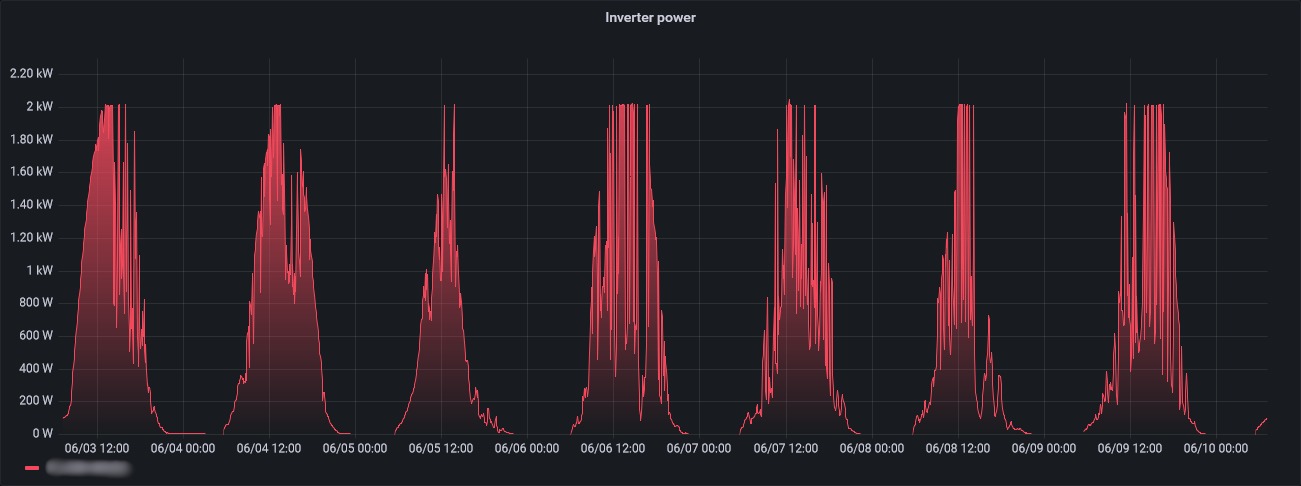
When everything is configured properly, just add the exporter to your Prometheus configuration. Since the shortest update inverval for the data logger seems to be 1 minute, a scrape interval in the same ballpark probably makes sense. Now, just add some cool visualizations in the visualization tool of your choice and enjoy.
Some sample graphs: